
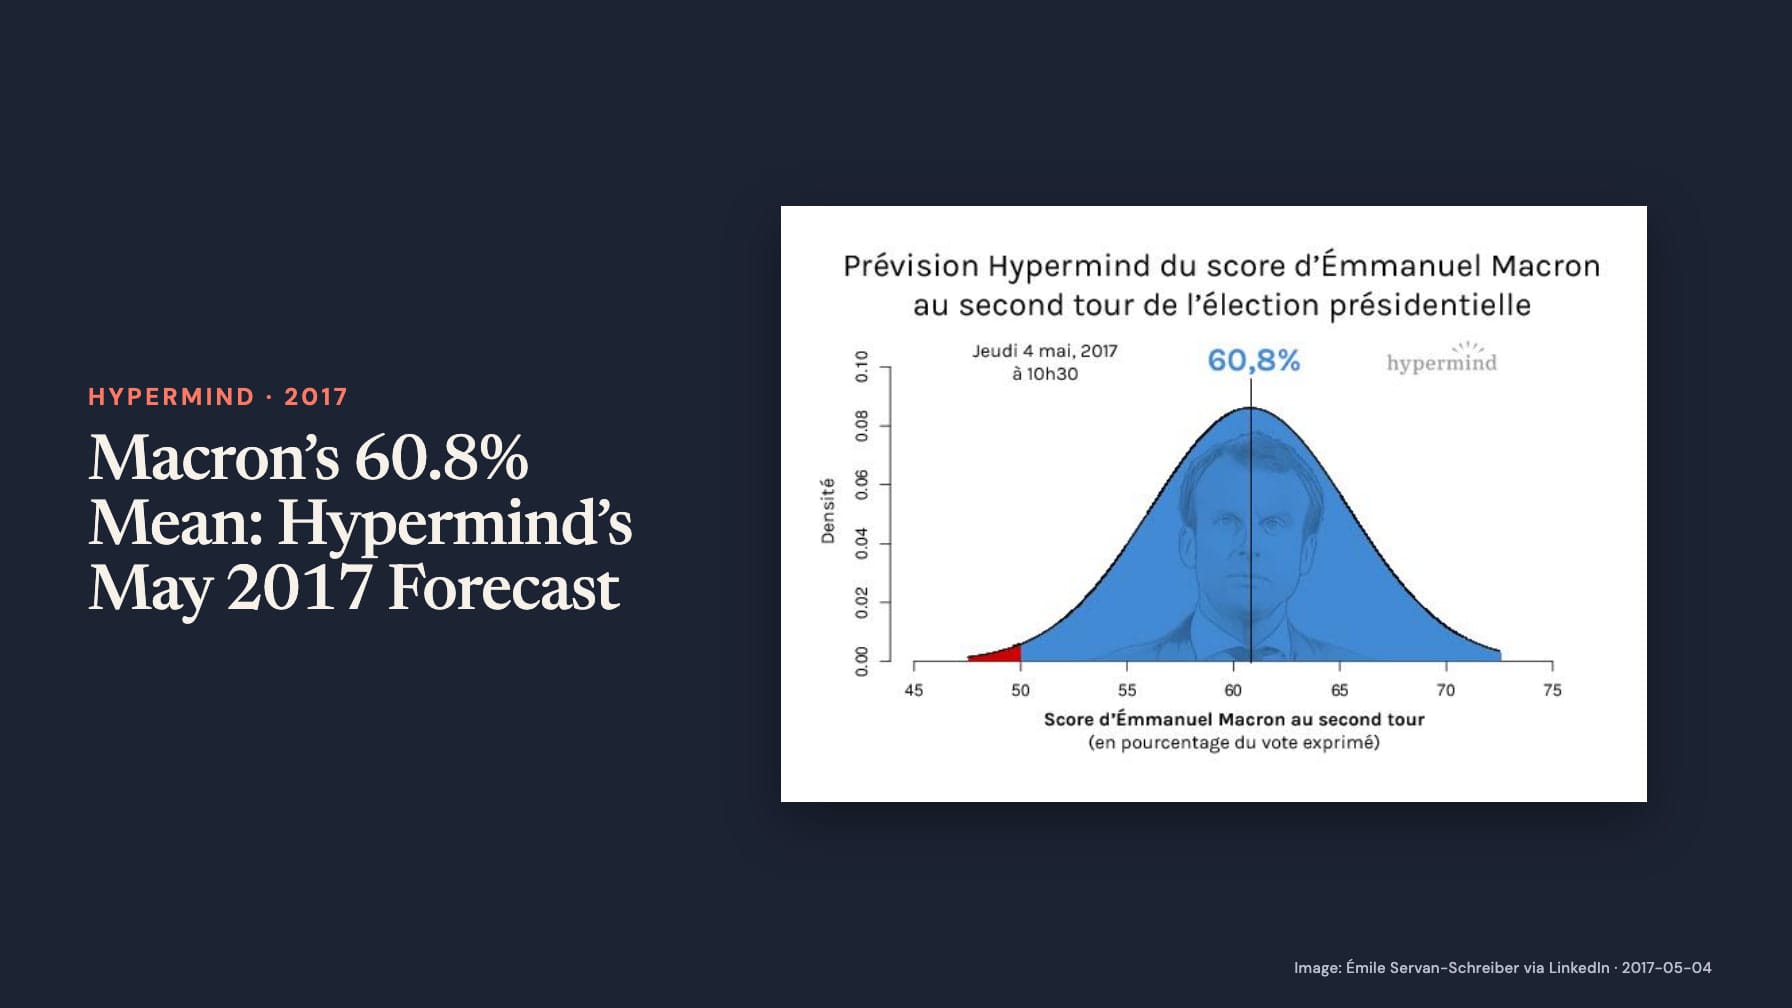
On the morning of 4 May 2017, Émile Servan-Schreiber shared Hypermind’s probability distribution for Emmanuel Macron’s score in the presidential run-off. He reported a mean of 60.8% and said he was waiting to see what the post-debate polls would show. The image itself is labelled Thursday 4 May, 10:30.
The horizontal axis identifies Macron’s share of votes cast for the candidates. The vertical axis is density: the graphic represents a distribution of possible vote shares. The highlighted 60.8% is a mean vote-share forecast, not a 60.8% chance that Macron would become president. The red area below 50% shows a losing region, but its numerical probability is not printed and cannot safely be reconstructed from the image.
Different questions produce different percentages
An earlier contract illustrates the contrast. On 23 June 2015, Servan-Schreiber shared a Le Point–Hypermind chart asking who would become French president in 2017. The visible snapshot put Alain Juppé at 30%, François Hollande at 26% and Nicolas Sarkozy at 25%. Those numbers assigned chances to named winners; the May 2017 distribution instead assigned uncertainty to the size of one candidate’s vote share.
A different image, shared on 22 October 2015, photographed a Le Point report on the right-and-centre primary. Its highlighted sidebar said François Fillon’s market price had tripled since the release of his book and gave him between 10% and 15% chances of winning that primary. It placed Juppé at 40–45%, Sarkozy at 35–40% and Bruno Le Maire around 5%. The figures describe chances of winning the primary, rather than shares of voters supporting each candidate.
On 21 March 2017, Servan-Schreiber promoted a real-time dashboard. Its screenshot carries an earlier update stamp, 20 March, and separates chances of winning the election from chances of reaching the second round. Macron’s presidency probability was displayed at 58.8%; his qualification probability at 71.7%. Le Pen’s corresponding values were 15.5% and 83.8%.
A candidate can have a high chance of reaching a run-off and a much smaller chance of winning it. Likewise, a primary-victory contract can resolve successfully while a presidential-victory contract on the same person does not. The four snapshots describe successive questions, not one uninterrupted measurement.
The vote-share outcome
The Interior Ministry’s official results record Macron receiving 66.10% of the expressed vote on 7 May 2017. The result exceeded the 4 May mean by 5.30 percentage points. That arithmetic describes the error of this dated point estimate; it is not a score for the complete probability distribution.
The broader 2017 market-history article follows how the market’s assessments changed through the race. This comparison instead concerns how to interpret the different questions. Reading the forecasts correctly therefore requires two checks: identify what quantity the percentage describes, then identify when it was recorded. A distribution mean, an election-victory probability and a run-off qualification probability cannot substitute for one another.