
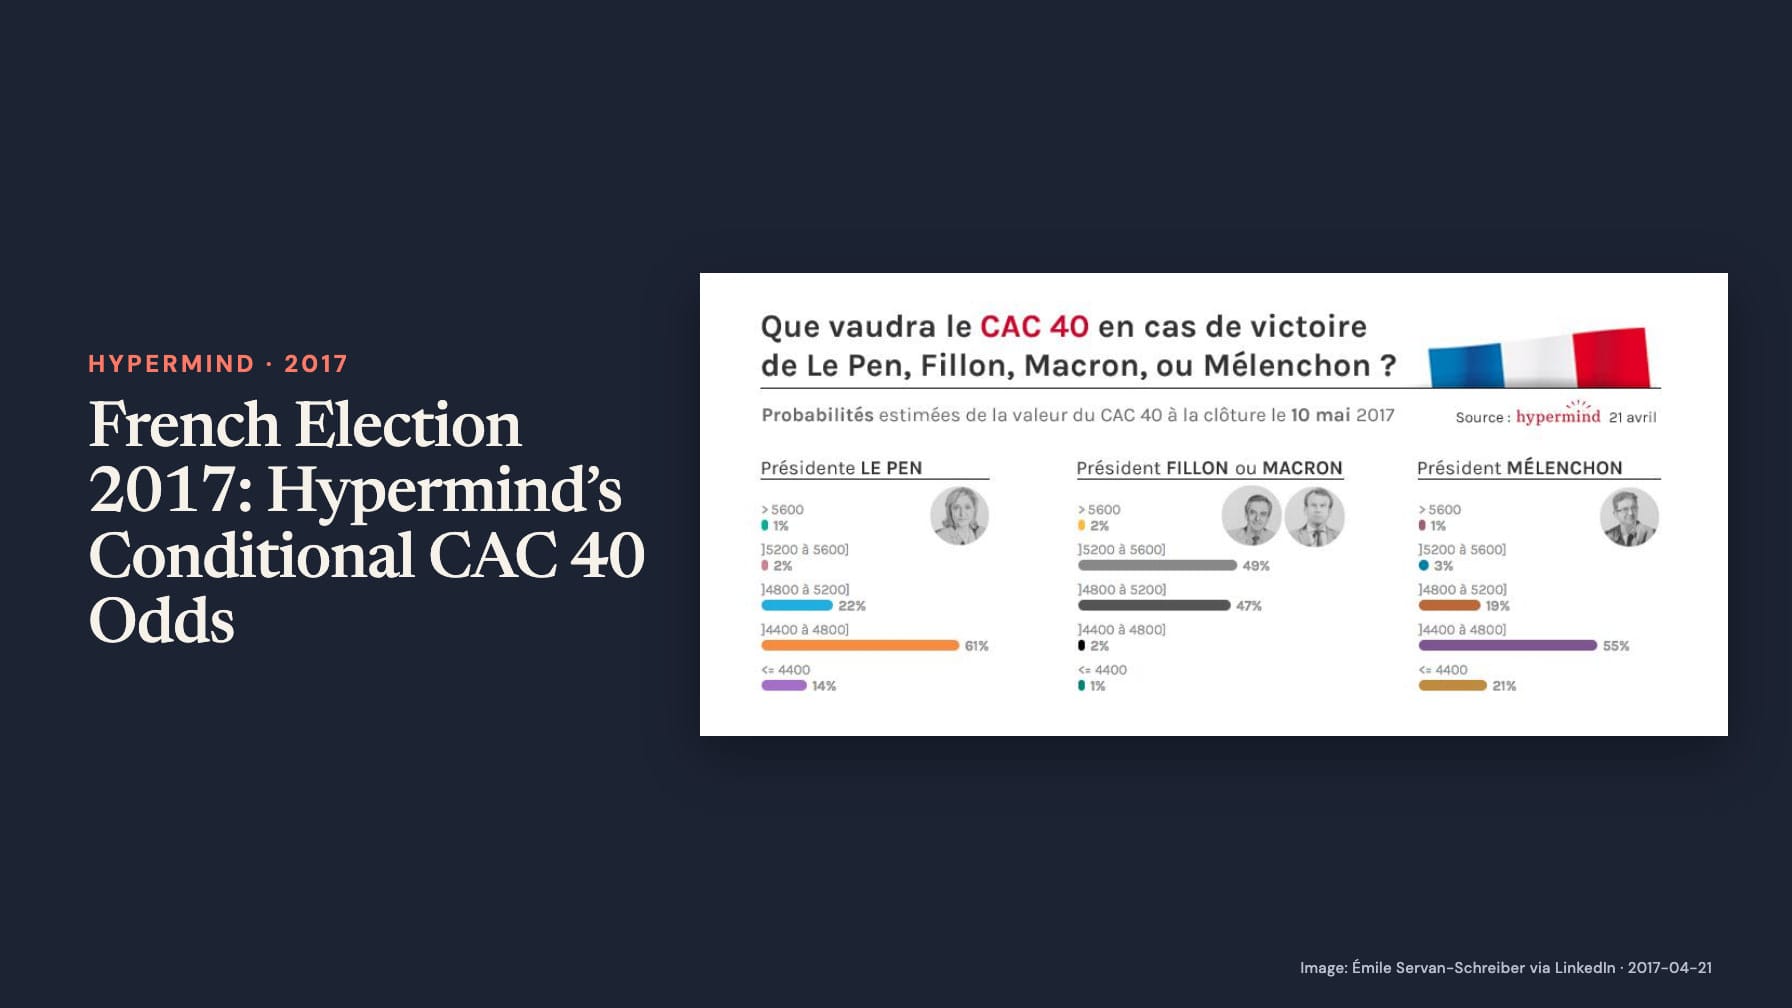
On 21 April 2017, two days before the first round of France’s presidential election, Émile Servan-Schreiber shared Hypermind forecasts of how the next president might affect the French stock market. The attached chart supplies a precise horizon: the CAC 40’s closing value on 10 May 2017. Its distributions were conditional on the winning candidate, with François Fillon and Emmanuel Macron grouped together.
The probabilities exactly as printed
The chart divides the index into five bands: above 5,600; above 5,200 up to 5,600; above 4,800 up to 5,200; above 4,400 up to 4,800; and 4,400 or below. For those bands, in that order, it gives:
- A Le Pen presidency: 1%, 2%, 22%, 61% and 14%.
- A Fillon or Macron presidency: 2%, 49%, 47%, 2% and 1%.
- A Mélenchon presidency: 1%, 3%, 19%, 55% and 21%.
These are the displayed figures, without adjustment. The Fillon–Macron column sums to 101% and the Mélenchon column to 99%; the original chart does not explain those small total discrepancies. The two largest displayed probabilities under Fillon or Macron occupy the 4,800–5,600 range, while the largest band under either Le Pen or Mélenchon is 4,400–4,800.
A conditional question, separate from the winner’s odds
The chart asks what the index might be if a candidate wins. It does not give any candidate’s probability of winning. The distinction allows a forecaster to consider a low-probability political result that might nevertheless have a large economic consequence. Our history of the election’s winner market covers that separate question.
Nor do the differences between columns prove a causal effect of a presidency. They record the crowd’s conditional expectations at one point in the campaign. Other news and market forces could affect the index over the same period, and the chart contains no counterfactual experiment.
The realised branch
Macron won the election held on 7 May, with 66.10% of votes cast for candidates, according to France’s official election archive. The CAC 40 closed at 5,400.46 on 10 May, as contemporaneous market reporting recorded; the Philippine Bureau of the Treasury’s bulletin for 11 May independently lists the same French index value using Bloomberg data for 10 May.
The observed close therefore lies in the 5,200–5,600 band, which carried 49% in the Fillon–Macron column. The other presidencies did not occur, so their conditional distributions cannot be checked against realised index values. Only the Macron branch can be compared with an observed close. A full assessment of conditional forecasting would need many such comparisons, including cases in which the realised value falls in a less likely band. The result here documents one expectation and its outcome; it does not by itself establish calibration.