
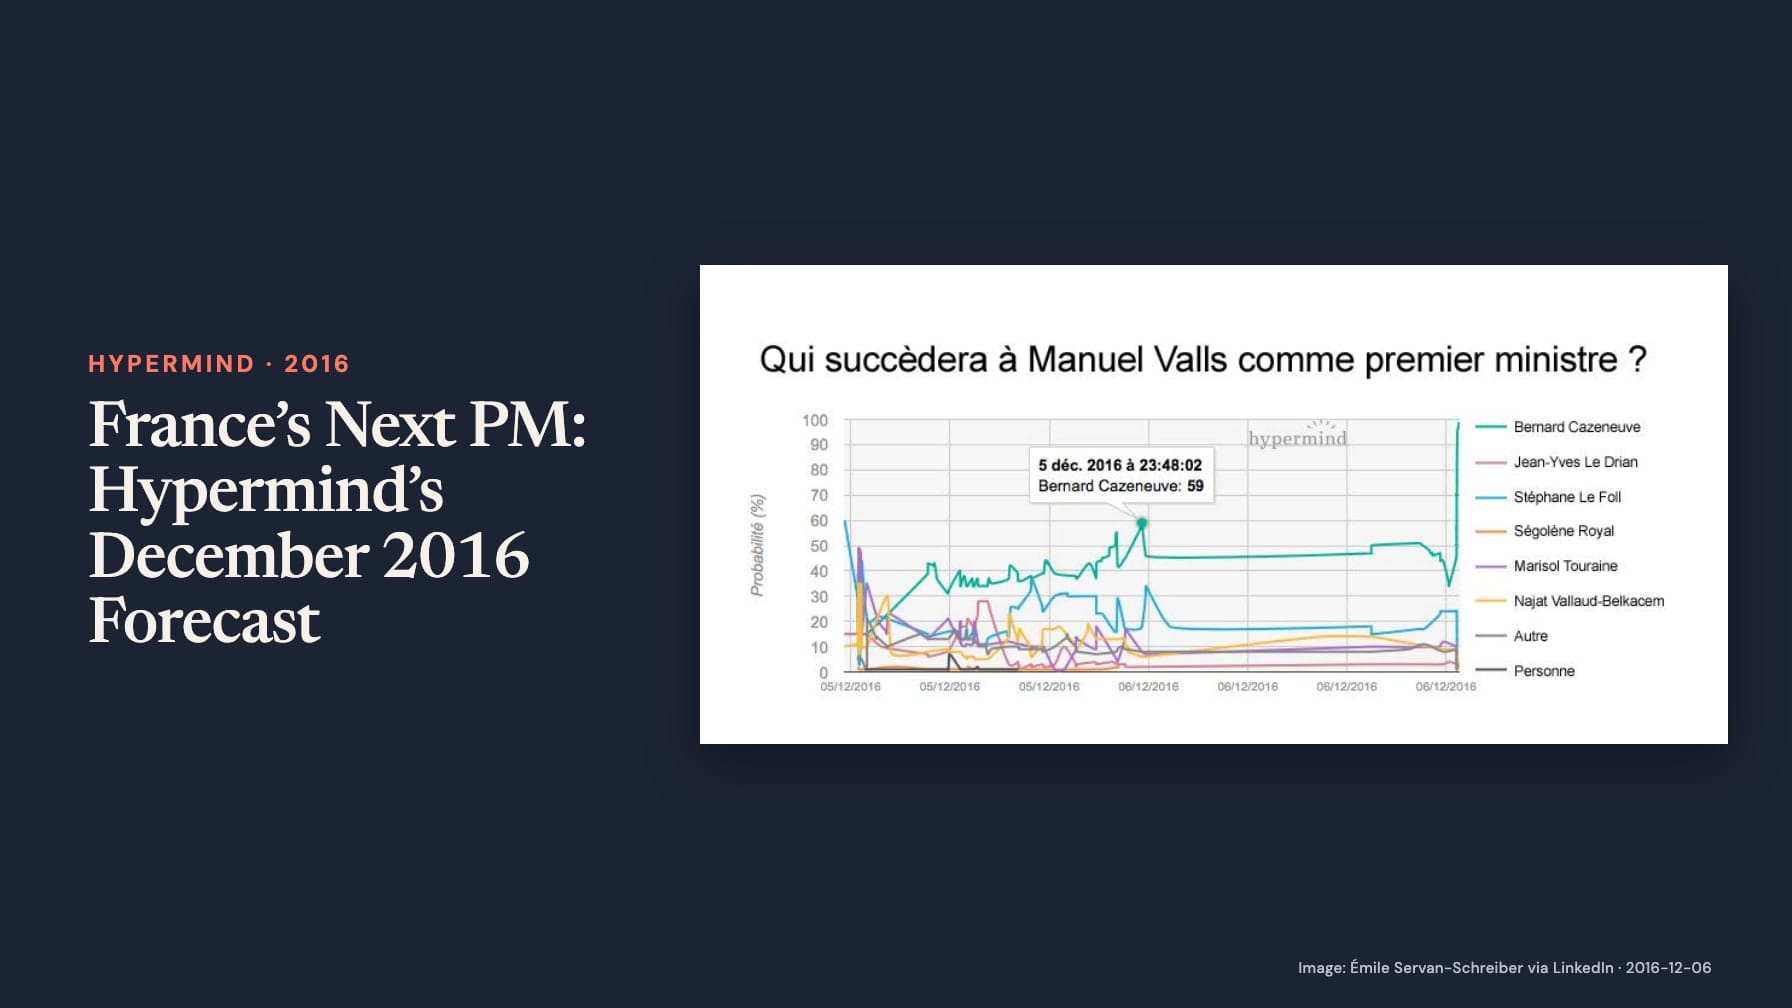
On 6 December 2016, Émile Servan-Schreiber shared a Hypermind chart illustrating how the market had assessed France’s next prime minister before the announcement. The chart contains a dated observation from the preceding night: Bernard Cazeneuve at 59 on the probability scale, marked 5 December 2016 at 23:48:02.
Who would succeed Manuel Valls?
The chart’s French question asks who would succeed Manuel Valls as prime minister. Its legend includes Cazeneuve, Jean-Yves Le Drian, Stéphane Le Foll, Ségolène Royal, Marisol Touraine, Najat Vallaud-Belkacem, another candidate and nobody. It is a multiple-outcome appointment question, separate from the presidential-election markets running during the same period.
The vertical axis is labelled probability in percent, making the highlighted Cazeneuve observation 59%. The timestamp is printed on the image, but no timezone accompanies it. The LinkedIn post itself is dated 6 December at 11:36:57 UTC. Those two times serve different purposes: one identifies a historical market observation; the other records when Servan-Schreiber shared the chart.
The candidates’ curves show the competing possibilities surrounding the highlighted Cazeneuve observation. The visible graph later rises to near-certainty for him on 6 December; that later movement should not be substituted for the earlier 59% when describing the forecast. A precise observation cutoff preserves the uncertainty traders faced before the choice was announced.
The official appointment
The decree dated 6 December 2016, published in the Journal officiel on 7 December, states that Bernard Cazeneuve was appointed prime minister. The Ministry of the Interior’s historical biography independently records the same date. These primary records confirm the outcome the market question concerned.
Servan-Schreiber described the market as a way to guess the successor the day before he was revealed. The chart provides a concrete prior-night probability, making that description more informative than a bare claim that the market named the winner. The 59% observation describes a favourite who was still far from certain to be chosen.
Forecasts before an announcement and prices after it
This case illustrates why a historical market needs an observation cutoff. A retrospective graph can contain both genuine uncertainty and the sharp rise after information becomes public. Reporting the earlier 59% preserves uncertainty at the point that can reasonably be called a forecast.
The journal’s history of Hypermind’s 2017 presidential market covers a longer campaign. This appointment market concerns a shorter horizon and a different decision. The common discipline is to retain the original question, distinguish dated prices from the publication of a retrospective chart, and verify the eventual result separately.