
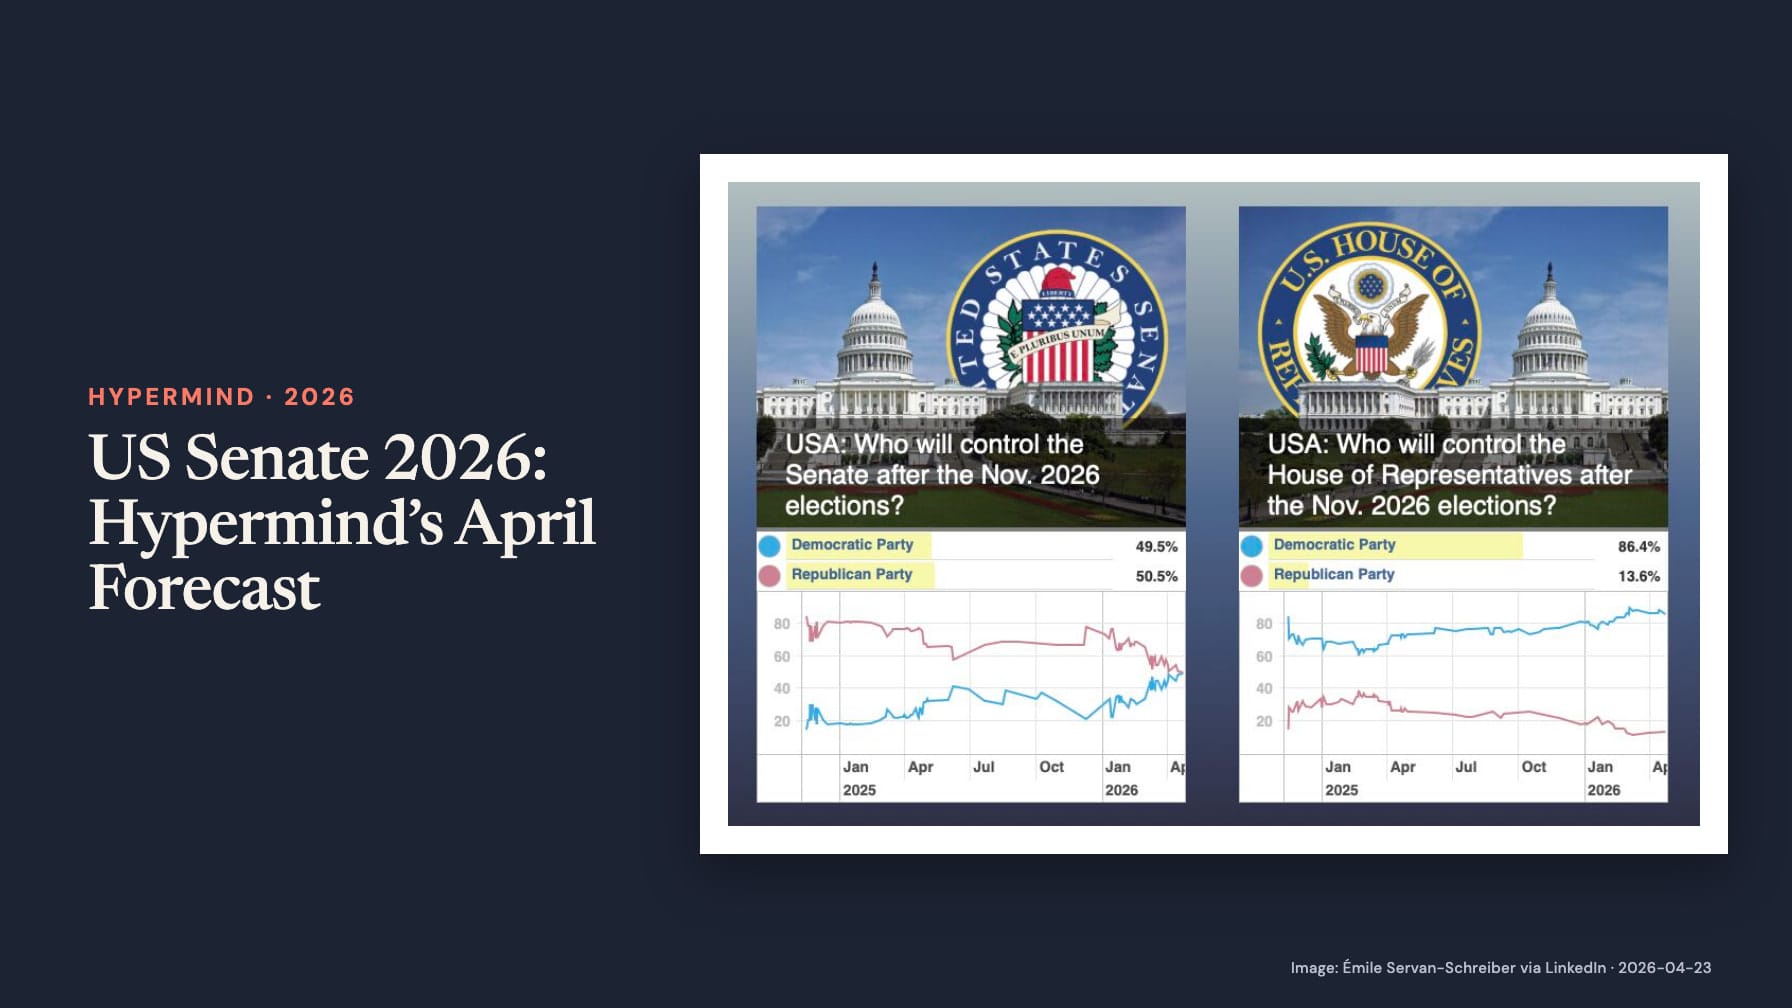
On 23 April 2026, Émile Servan-Schreiber shared a Hypermind prediction-market chart and drew attention to a change in the US midterm outlook: control of the Senate had become competitive. The chart put the Democratic Party at 49.5% and the Republican Party at 50.5% to control the chamber after the November elections. These were the market figures published with that post, rather than current odds.
Two chambers, two different forecasts
The Senate question shown in the image asked which party would control the chamber after the November 2026 elections. A second panel asked the equivalent question about the House of Representatives. There, the market assigned 86.4% to Democratic control and 13.6% to Republican control. The contrast was the substance of the update: a strong House favourite alongside a Senate contest separated by a single percentage point.
The Federal Election Commission’s 2026 congressional calendar lists the general election for 3 November. The forecast therefore concerned control after an election still several months away when the chart was shared. Its full settlement rules are unavailable.
What the chart establishes
The history lines show the two Senate probabilities drawing closer towards the April snapshot. Servan-Schreiber interpreted this as a significant development. The comparison between chambers matters because a forecast about Congress can hide two very different assessments: the market could be confident about one chamber while remaining almost evenly divided about the other.
A 49.5% probability of Democratic control is not a forecast of Democratic vote share, nor does it say that each Senate race is equally competitive. It expresses uncertainty about the final control outcome. Our prediction-market explainer describes the distinction between an outcome’s market price and a poll of voter preferences.