
On 19 October 2024, about two weeks before the US presidential election, Émile Servan-Schreiber posted a bar chart of Kamala Harris’s chances of winning on eight forecasting venues. They split into two camps. In blue were venues that pool the judgement of forecasters with track records, plus one poll-based model. In red were betting platforms, most of them trading in real money.
- Blue: Hypermind 56%, Metaculus 56%, Good Judgment 52%, and FiveThirtyEight’s poll-based model 51%.
- Red: PredictIt 47%, Manifold 46%, Betfair 41%, Polymarket 40%.
Servan-Schreiber, who leads Hypermind, called the polarisation striking. He wrote that it went to the heart of a long-standing debate: should you trust platforms that let people put their money where their mouth is, or play-money competitions that pool the opinions of forecasters with good track records? In a play-money venue, nobody risks their own cash. Participants trade or submit forecasts with virtual points and are ranked, and sometimes rewarded, on accuracy.
He predicted that journalists would fixate on the red bars and forecasting experts on the blue. In the comments he added a caution that applies to both camps:
It’s just probabilities, which in this case are really close to a coin flip.
Émile Servan-Schreiber, LinkedIn comment, 19 October 2024
How Hypermind’s probability moved before the comparison
The October chart was one point in a longer public trail. On 17 July, Hypermind gave Trump 63%, the same probability Servan-Schreiber said Hillary Clinton had held on that date in 2016. Two days later its market strongly favoured Harris as Biden’s eventual replacement. Trump remained the election favourite on 23 July, but Hypermind had already erased the probability boost that followed the first assassination attempt. By 2 August it put a Democratic win at 55%, up from 40% when Biden left the race on 21 July; after Harris chose Tim Walz, Trump fell below 40%.
The September debate pushed Harris on Hypermind from 60% to about 65%. On 12 September, Trump reached a low near 33%; the next day Hypermind said that was below his position at the same point in 2016 and 2020. A second assassination attempt on 15 September produced no visible movement. These posts show a responsive time series, but they also make the eventual miss clear: the market’s late-summer movement toward Harris did not reverse before Trump won.
The divergence persisted into the final weekend. On 1 November, Servan-Schreiber wrote that Hypermind was still the only model in his comparison slightly favouring Harris, while the other models had begun moving back towards her. On 3 November, his averages put Harris at 55% across Hypermind, Good Judgment and Metaculus, 49% across betting platforms and 48% across statistical models. Those dated snapshots lead directly into the election-morning comparison below.
A week later: one venue left above 50%
By 26 October, Servan-Schreiber noted that Hypermind was the only crowd-forecasting platform or statistical model he tracked that still gave Harris slightly better than even odds, at 54%. He stressed that the threshold was largely symbolic: for a one-off event, he wrote, there is no practical difference between 55% and 45%. Both are a toss-up.
He suspected herding. The platforms, he argued, were not thinking independently but watching one another’s forecasts. In his words, ever since Polymarket “went full Trump with a suspected price manipulation”, the other real-money markets had followed, and he wrote that it was hard to tell whether they did so blindly or wisely.
The background was a set of very large Trump bets on Polymarket. On 23 October, Gizmodo reported that the platform was looking into its biggest Trump bettors, at a time when it showed Trump at 64% and Harris at 35%. Three days later, Fortune reported that Polymarket had traced four accounts to a French national. Polymarket said he was “taking a directional position based on personal views of the election”, rather than manipulating the market.
Replying to a reader, Servan-Schreiber set out his objection to the main money markets. On Betfair, Manifold and Polymarket, he wrote, “mad billionaires or nefarious state actors” could move prices, because the amount someone can invest has nothing to do with their forecasting skill. PredictIt had the opposite problem: its $850 investment limit had stopped him buying the Harris shares he thought were cheap.
Election morning
By 5 November his chart covered eleven venues, grouped into three families, and the gap had widened.
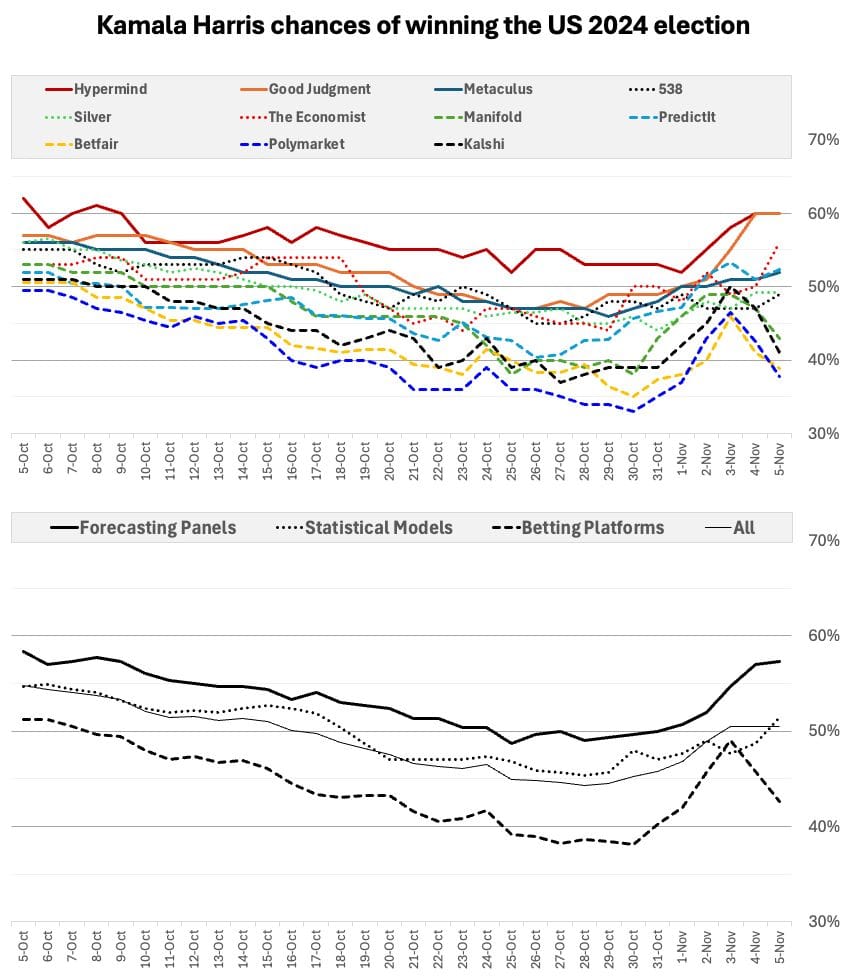
- Forecaster panels averaged 57% for Harris, though Metaculus stood near a coin toss at 52%.
- Betting markets averaged 43% for Harris. PredictIt was the exception at 52%.
- Statistical models averaged 51%. The Economist’s model moved overnight from 50% to 56% for Harris.
The day before, he had also pointed to a split inside the betting camp. US-based markets gave Harris 48% on average, against 42% on foreign-based ones.
The result, and what it does and does not show
Donald Trump won 312 electoral votes to 226 and carried all seven swing states. On this question, the real-money markets had the winner as favourite, and the forecaster panels, Hypermind included, did not.
Within a week Servan-Schreiber gave an interview to the French site Atlantico, headlined “Prediction markets worked very well for the election of Donald Trump.” He said that on the eve of the vote, poll aggregators such as The Economist, FiveThirtyEight and Nate Silver were at 50/50, while the biggest markets, Betfair, Kalshi and Polymarket, had Trump at about 60%. He cited the Iowa Electronic Markets, which beat 964 polls in 72% of comparisons across five presidential elections from 1988 to 2004. The interview did not address the fact that Hypermind’s own panel had leaned towards Harris.
A single election cannot decide the money question either way. A 57% forecast for the candidate who lost is not refuted by the loss. It would be refuted only if, across many such forecasts, 57% events kept happening much less often than 57% of the time. Accuracy is measured with tools such as the Brier score: the squared gap between the probability given and what happened, averaged over many questions, where lower is better. On one question, both camps were close to a coin flip, as Servan-Schreiber had said.