
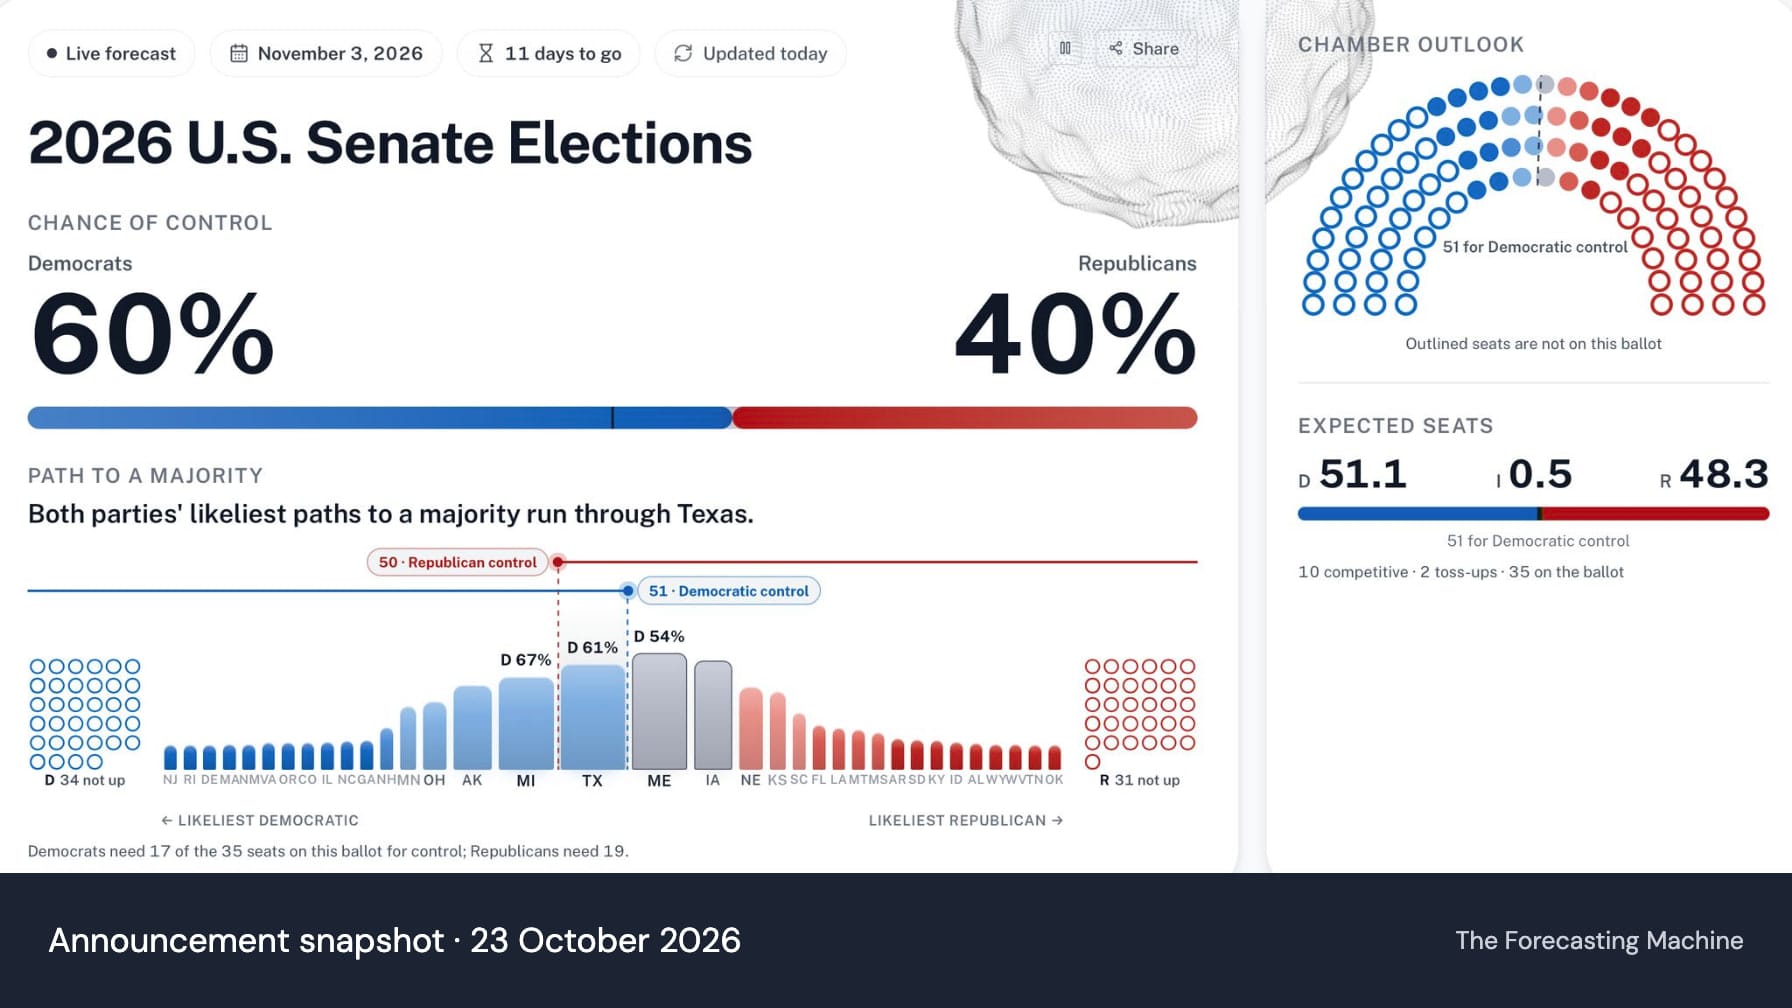
On 23 October 2026, Émile Servan-Schreiber announced that The Forecasting Machine’s U.S. midterm election forecasts were publicly available. His first-comment link leads to the 2026 U.S. Senate election dashboard, where readers can explore individual races and the outlook for control of the chamber without signing in. The Federal Election Commission’s calendar sets the general election for 3 November.
The public page brings the forecasts and their explanations into one place. It connects an overall assessment of the Senate with the individual questions behind the seats on the ballot, so readers can move from a national headline to the reasoning about a particular race.
How to read the Senate election map and control probability
The dashboard presents race win probabilities, expected seats and a separate probability of chamber control. Its map, chamber view and path to a majority offer different ways to read the same election: where the contests are, how the seats would sit, and which races stand between a party and control. Opening a race reveals its analysis and a link to the full reasoning and sources.
Those measures answer different questions. An expected seat total averages across possible outcomes; it is not a promise of a particular final tally. The page’s methodology also explains that chamber control is forecast through its own question, rather than calculated by adding up the expected seats. Readers should therefore examine the control estimate and the race outlook together, without treating them as interchangeable.
The announcement’s 60–40 snapshot
The screenshot attached to Servan-Schreiber’s announcement showed a 60% chance of Democratic control and 40% for Republicans. These are the figures in the image published on 23 October, preserved below as a record of the announcement. They are probabilities of control, not vote shares, and they should not be read as the dashboard’s current values.
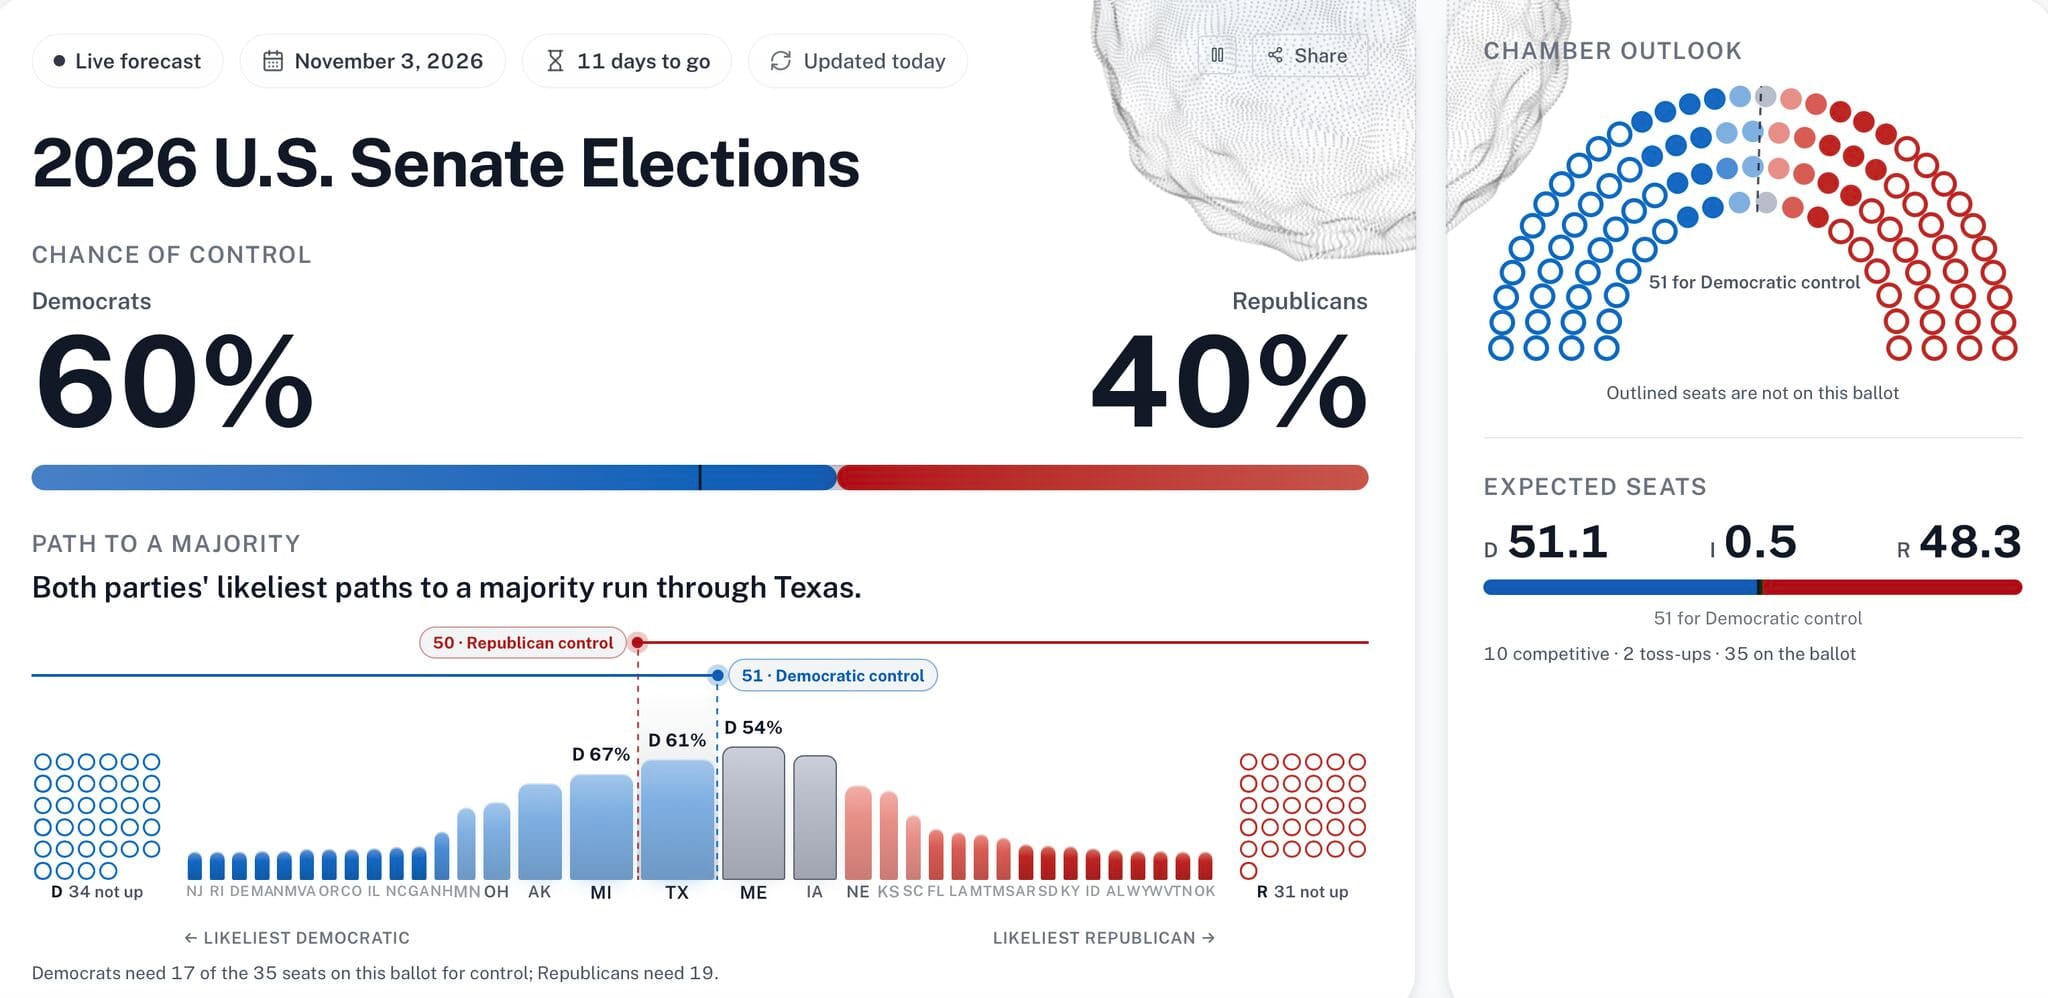
The live page reruns forecasts on a schedule through the campaign and refreshes while it is open. Its displayed update time matters when comparing a number with a poll, a market price or an earlier screenshot. Our guide to comparing AI forecasts and prediction markets explains why matching the outcome and evidence cutoff is essential.
How the AI election forecasts update
The dashboard’s methodology identifies its forecasts as AI-produced. It says that a human forecaster, pollster or election desk does not review each race before publication, and that there is no polling average underneath the page. This makes the accessible analysis important: readers can examine what the system cites and how it weighs the evidence, as well as the resulting percentage.
The published update policy stops forecasting on 3 November 2026 at 6:00 p.m. Eastern Time. Calling a result is a separate step: the methodology requires the forecast question to resolve and a person to confirm the outcome. Until that happens, the page retains the final forecast and marks the race as not yet called.
The launch opens a dated set of estimates to public examination before the election. Once outcomes are known, the probabilities can be evaluated against what happened; our Brier score and calibration guide explains how to assess such a record. For now, the useful starting point is the public dashboard itself: inspect a race, read its evidence and check when it was updated.