
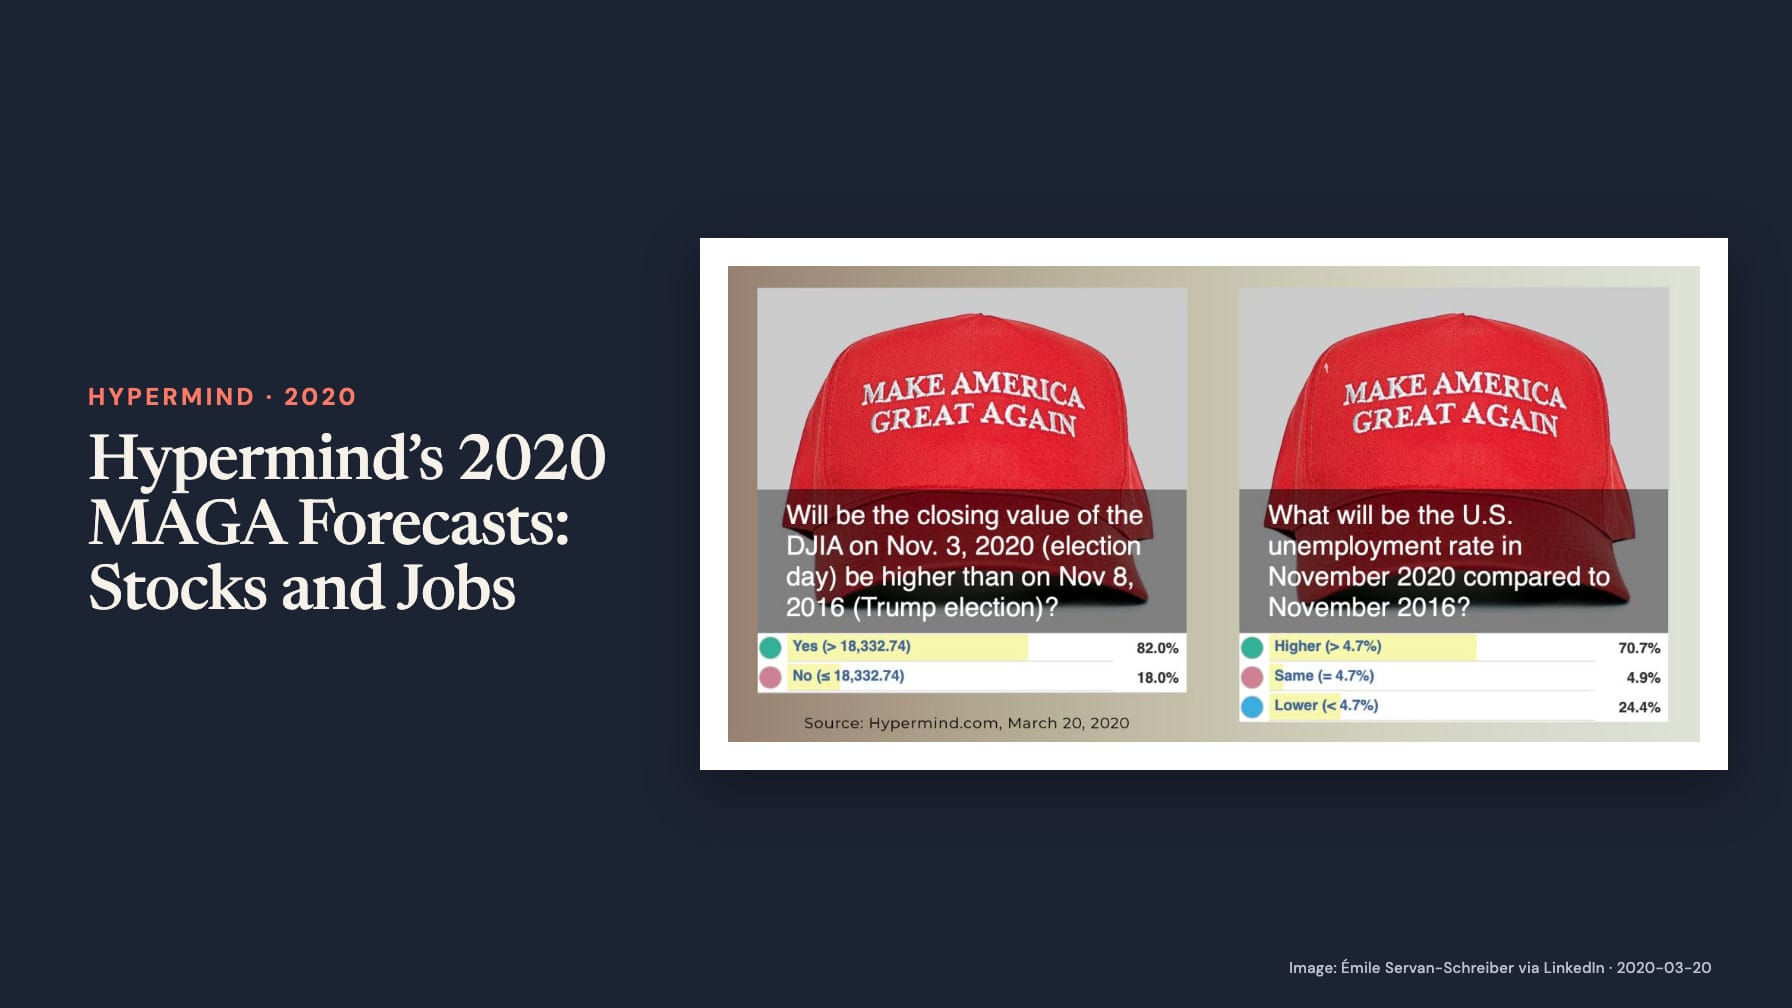
On 20 March 2020, Émile Servan-Schreiber asked whether Americans would be better off that November than four years earlier, when Donald Trump was elected. He directed readers to evolving Hypermind probabilities. The attached graphic translated the political question into two narrower comparisons: the Dow Jones Industrial Average and the US unemployment rate.
Two measures, two forecast horizons
The stock-market question asked whether the Dow’s closing value on 3 November 2020, election day, would exceed its close on 8 November 2016. The card specified a threshold of 18,332.74 points. On the graphic dated 20 March 2020, Hypermind assigned 82.0% to a higher close and 18.0% to a close at or below that threshold.
The unemployment question compared November 2020 with November 2016. Its displayed baseline was 4.7%. Hypermind gave 70.7% to a higher unemployment rate, 4.9% to the same rate and 24.4% to a lower rate. These were probabilities of three outcomes, not an unemployment-rate forecast of 70.7%.
The most likely answers therefore pointed in different directions: a higher stock index and higher unemployment. A slogan about being better off does not automatically produce one measurable verdict. The graphic made two tests visible, allowing readers to see why asset prices and labour-market conditions might tell different stories.
Checking the November observations
The Federal Reserve Bank of St. Louis’s FRED series, sourced from S&P Dow Jones Indices, records the Dow’s 3 November 2020 close at 27,480.03. That exceeds the threshold printed on the March card, so the outcome falls in the 82.0% higher-index branch. The comparison is an index-level comparison; it does not measure every household’s investment return or financial wellbeing.
The Bureau of Labor Statistics initially reported November 2020 unemployment at 6.7%, in its release of 4 December. That is above the card’s 4.7% benchmark, falling in its 70.7% higher-unemployment branch. The initial November 2016 release reported 4.6%, while the revised BLS series available through FRED gives 4.7% for that month. The chart’s threshold therefore matches the revised series rather than the original release. Full settlement rules, including the data-revision policy, are unavailable.
A term-end comparison, not a conditional policy experiment
These questions differ from the later Long Fork Project, which asked about outcomes under alternative results of the 2020 election. The March graphic asked what would be observed near the end of the current term. It did not estimate what the same outcomes would have been under a different president.
Servan-Schreiber described the probabilities as evolving. The figures here are the March 20 snapshot, rather than the last forecasts before resolution. The observed outcomes align with both most likely answers, but two cases cannot establish general accuracy. Their value is the question design: a broad political claim became explicit quantities, thresholds and dates that could be checked independently.