
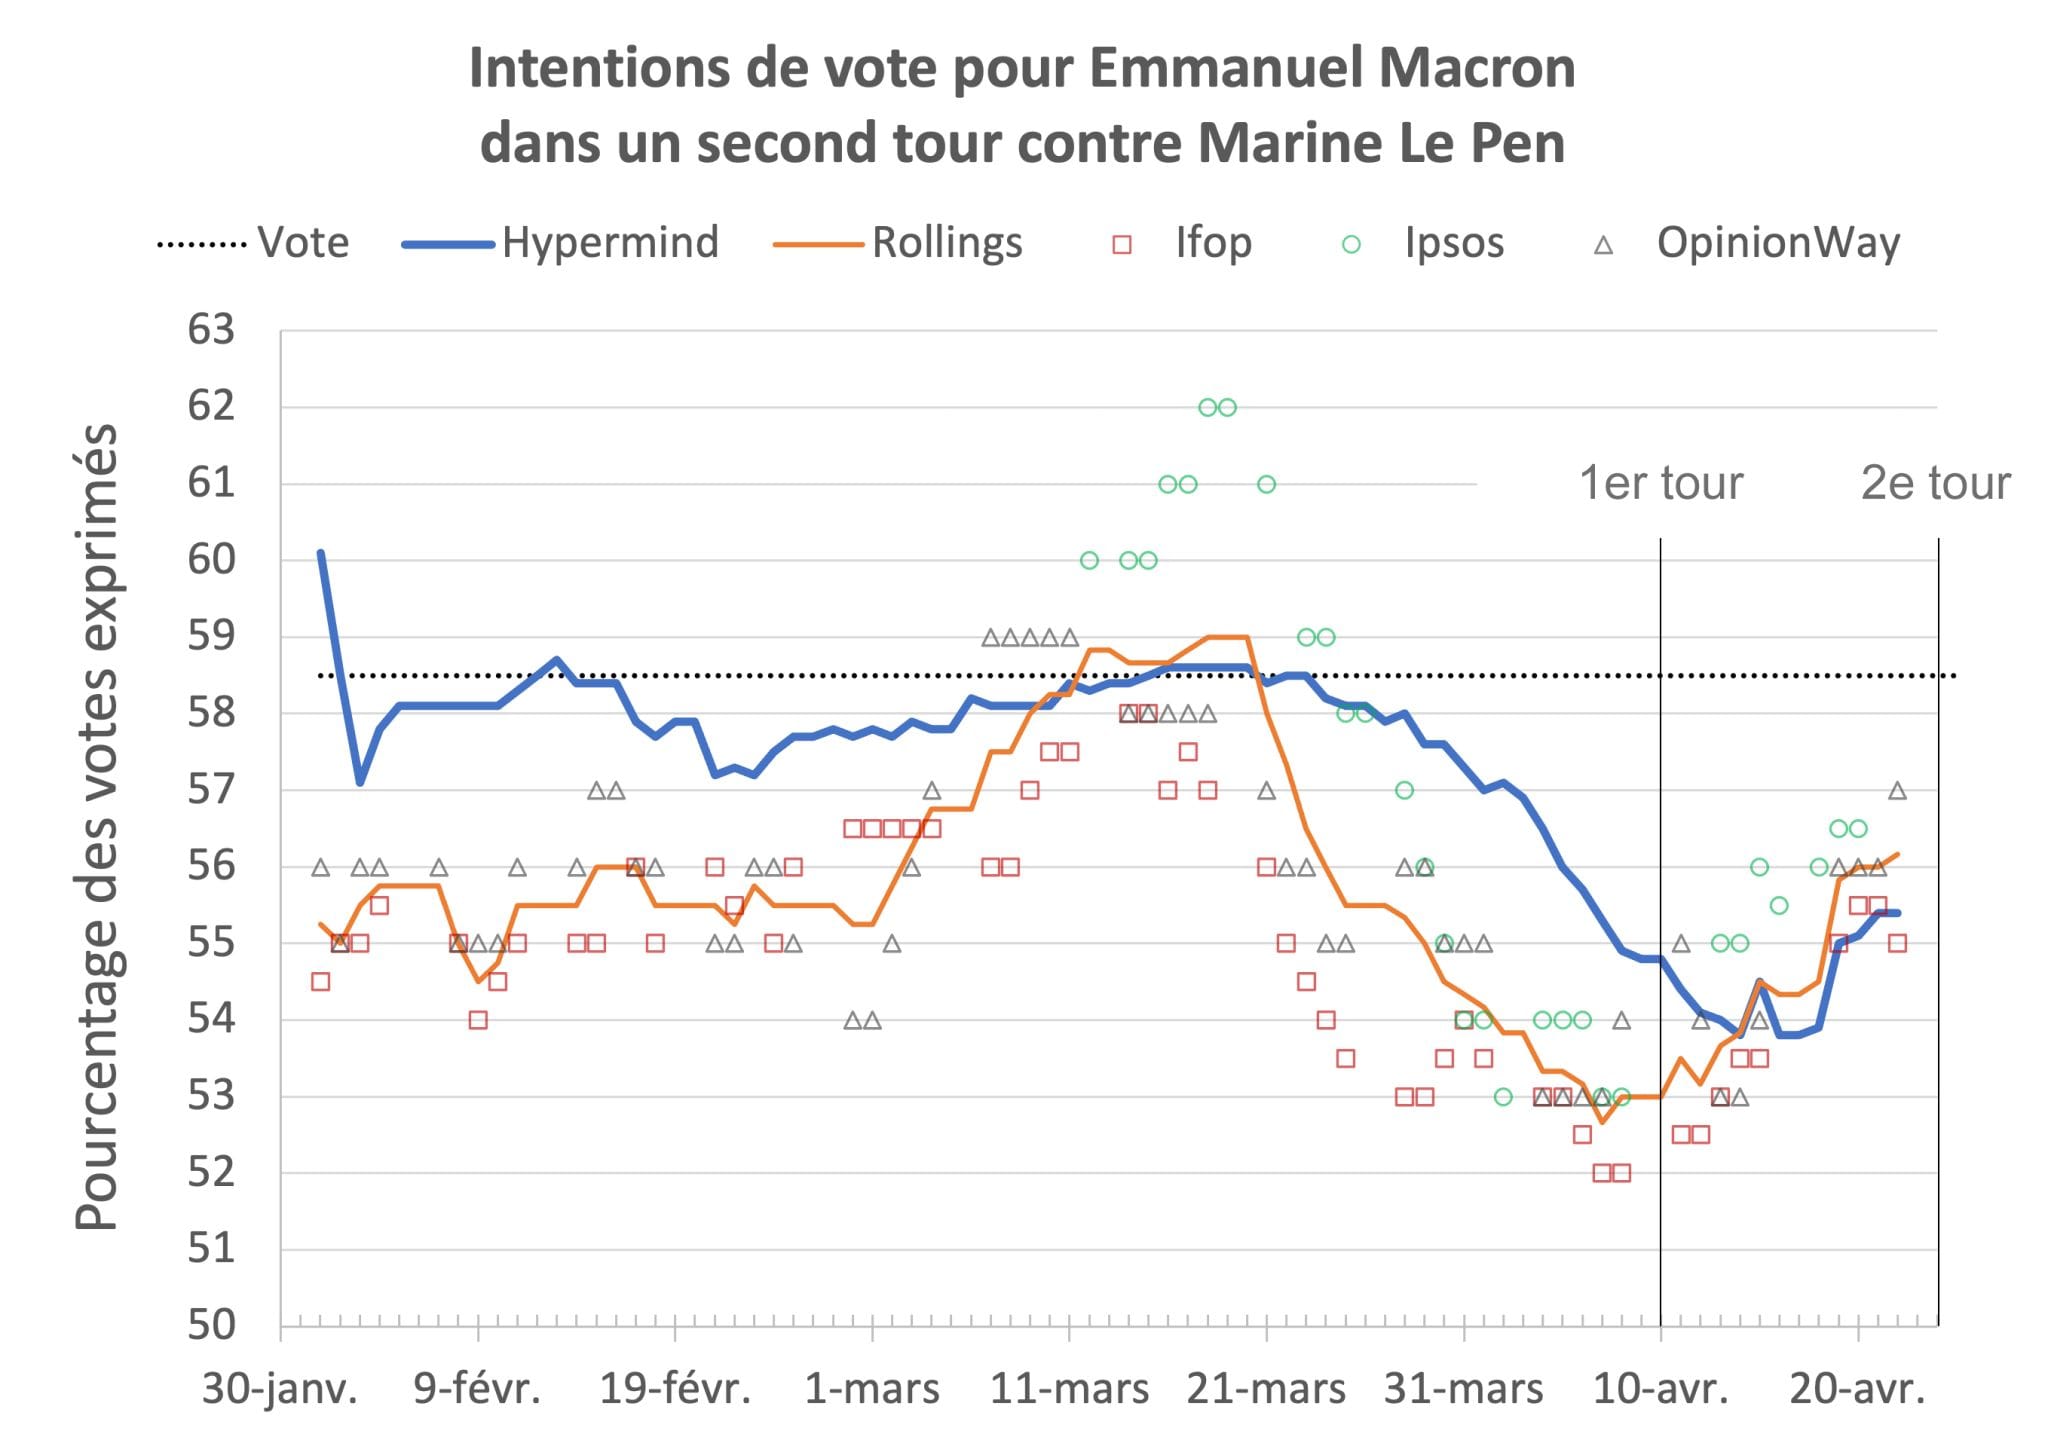
Emmanuel Macron was re-elected on 24 April 2022 with 58.55% of the vote against Marine Le Pen, according to the Conseil constitutionnel. On 2 May, Émile Servan-Schreiber published an analysis in Le Point asking a simple question. Over the campaign, who had been closer to that final score: the daily polls, or a few hundred readers betting on the outcome?
What was compared
On one side were the rolling polls of Ifop, Ipsos and OpinionWay. A rolling poll is published every day. Each day, a third of the sample is replaced, so the oldest interviews drop out and the figure moves with the campaign. Over the last twelve weeks, the three firms’ rollings together questioned about 100,000 voters.
On the other side was the Hypermind–Le Point panel, a forecasting contest with virtual bets on the final result, not a survey of voting intentions. Its few hundred amateur political scientists were recruited mainly among Le Point’s readers, and the best forecasters were rewarded. The collective forecast was a weighted average of the most recent half of individual forecasts. Extra weight went to people who updated often or had a proven record in earlier contests. Servan-Schreiber traced the method to research on collective forecasting run by US intelligence agencies over the previous decade.
The 2022 numbers
The comparison covered the 143 rolling polls published between 1 February and 22 April on a Macron–Le Pen run-off. For each poll, the panel’s estimate was taken a few hours before the poll came out.
- The panel was closer to Macron’s final score in 128 of the 143 comparisons, or 90%.
- By firm, it did better in 95% of comparisons with Ifop, 91% with OpinionWay and 77% with Ipsos, and in 87% of comparisons with the average of the three.
- The average gap between the daily estimates and Macron’s final score was 1.3 points for the panel and 2.9 points for the average of the rolling polls.
The chart published with the article adds a nuance. In the closing days, by our reading of it, the panel’s estimate still sat below Macron’s eventual score. Its advantage came from being nearer the result for most of the period, not from a pinpoint final call.
“Polls do not predict”
Servan-Schreiber anticipated the main objection. Pollsters often say that polls are never wrong because they measure intentions at a given moment and are not meant to predict. He cited Laurence Parisot, a former head of Ifop, as one of those who have made the point. He called the argument technically true but somewhat misleading, because people who read election polls want forecasts. A method that sets out only to forecast, he argued, complements polls rather than replacing them.
Not a one-off: 2017
To rule out luck, the article went back to 2017, when the suspense lay in the four-way first round between Macron, François Fillon, Le Pen and Jean-Luc Mélenchon. Ifop’s and OpinionWay’s rollings then published “victory forecasts”: the share of respondents who expected each candidate to win. Over the ten weeks before the first round, the market’s daily forecast was more accurate than Ifop’s in 93% of cases and OpinionWay’s in 89%.
Measured with the Brier score, the panel was on average 27% better than Ifop and 19% better than OpinionWay. The Brier score is the squared error between the probabilities given and what happened, so lower is better: a perfect forecast scores 0, and a random guess across five options scores 0.8.
Before the war: a poll model under scrutiny
Three months earlier, on 3 February 2022, Servan-Schreiber had compared the panel with The Economist’s new poll-based model, which gave Macron about 80% to be re-elected while Hypermind had him near 60%. He argued that such models aggregate past and present polls and ignore what might still happen, citing among his examples a war in Ukraine. Russia invaded three weeks later. He added a line from the poet Paul Valéry:
History, said Paul Valery, is the science of things that do not repeat themselves.
Émile Servan-Schreiber, LinkedIn comment, February 2022
Both the model and the market had Macron as favourite, and he won, so one result cannot show whose probability was better calibrated. What the February exchange does show is the difference in approach: the market priced in surprises that had not yet happened.
The campaign through the market
The Le Point article also read the campaign through the panel’s odds. According to the market, Mélenchon never had more than 5% chance of winning, and Le Pen peaked below 20% just before the first round. Valérie Pécresse reached almost 30% after winning the Les Républicains primary. Éric Zemmour came close to 40% in October 2021 and, after a brief recovery, fell back once Russia invaded Ukraine at the end of February. Macron, for his part, stayed between 50% and 65% from early 2021 to the end of February 2022. Servan-Schreiber concluded that the invasion was probably the deciding factor.
He also set the result in a longer history. Scientific polling dates from George Gallup in 1936. Before that, he wrote, researchers found that in 14 US presidential elections between 1880 and 1932, the betting favourite on Wall Street lost only once.