
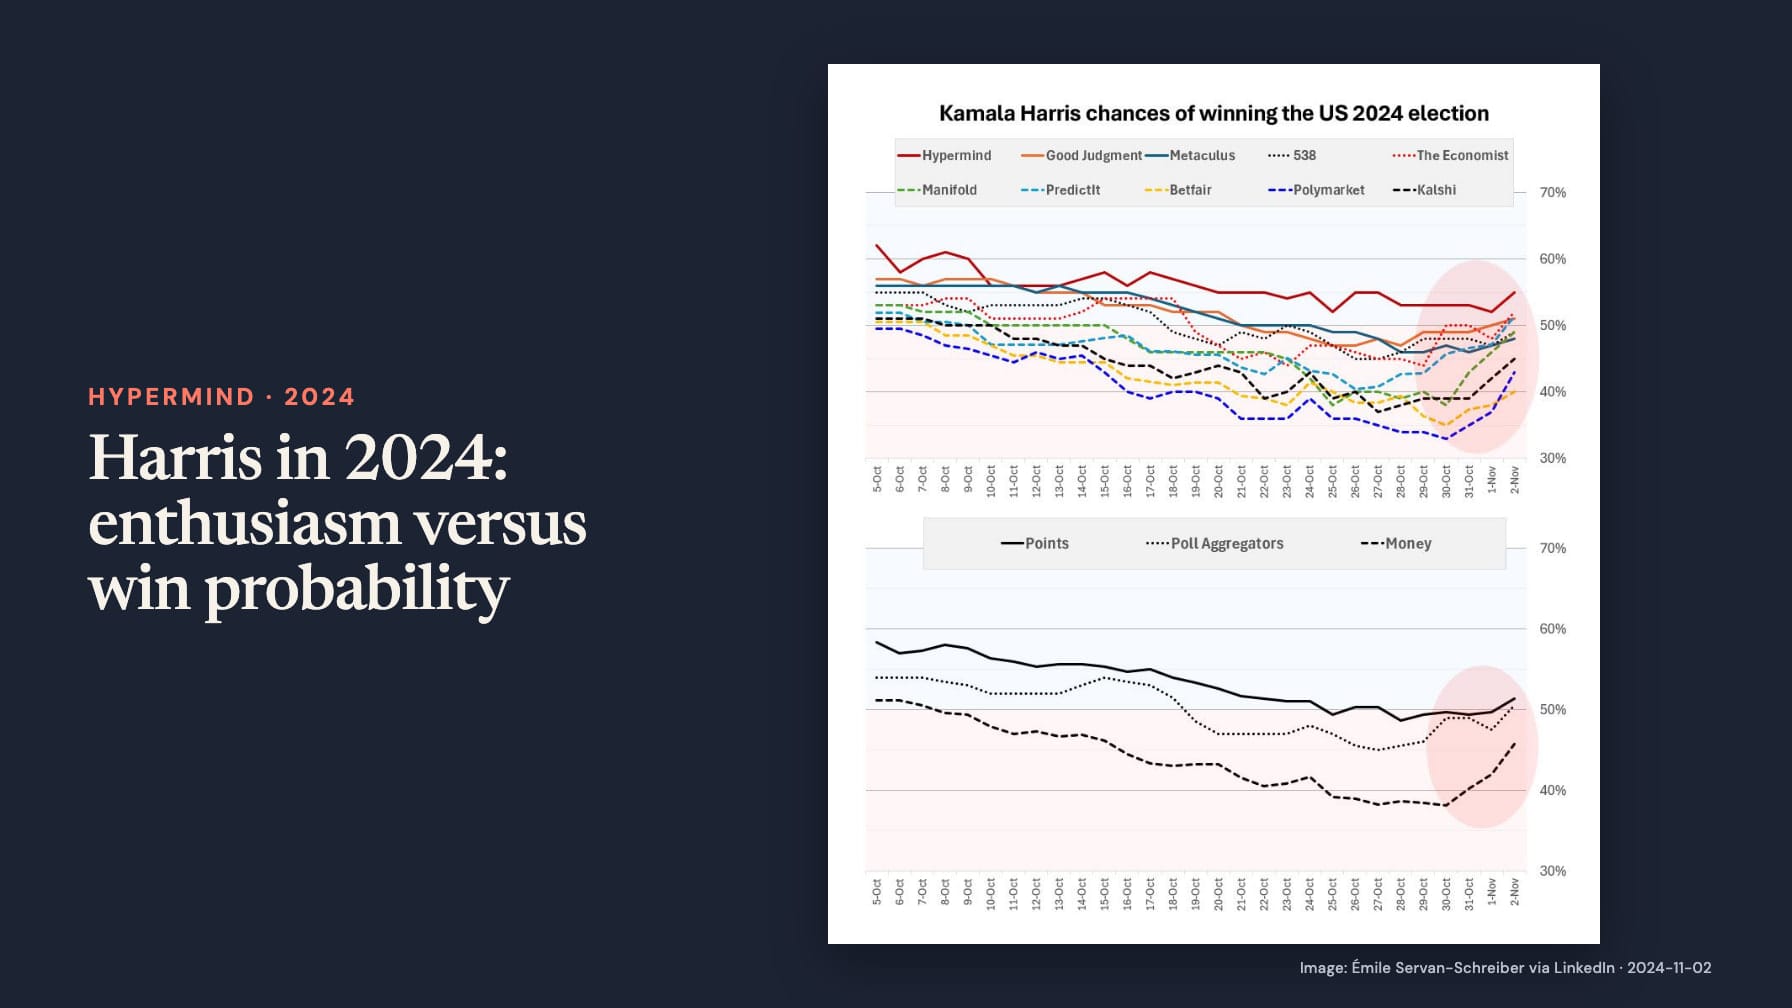
On 2 November 2024, three days before the US presidential election, Émile Servan-Schreiber reported a small movement back toward Kamala Harris. That morning, Central European Time, he gave her chances as 52% in The Economist, 51% in Good Judgment and 51% in PredictIt. These were his dated observations of three forecasting sources.
What Gallup measured
Two days earlier, Servan-Schreiber had welcomed Gallup’s voter-enthusiasm findings as good news for Harris. Gallup’s 31 October report, based on a survey conducted from 14 to 27 October, found that 77% of Democrats and Democratic-leaning registered voters were more enthusiastic than usual about voting, compared with 67% of Republicans and Republican leaners.
That ten-percentage-point gap measured people’s reported enthusiasm relative to previous elections. It was not a ten-point lead in voting intentions and did not assign Harris a 77% chance of winning. It could inform a judgement about participation, but turning it into an election forecast required additional assumptions about who would vote and how.
The historical comparison needed care
Servan-Schreiber wrote that such a large enthusiasm gap had not been seen since Barack Obama’s 2008 election. Gallup’s own discussion was more cautious: Democratic enthusiasm advantages preceded wins in both 2008 and 2020. A Republican advantage in 2012 preceded a loss. Gallup described the measure’s relationship with election outcomes as mixed.
The enthusiasm lead was therefore a relevant signal, rather than a decisive forecast. It could coexist with the near-even win probabilities Servan-Schreiber reported on 2 November. Those percentages answered a different question: which candidate would win the election, rather than how motivated one party’s supporters felt.
Check the signal against the result
The National Archives records Donald Trump’s victory with 312 electoral votes to Harris’s 226. The result shows why an encouraging campaign indicator should not be treated as an outcome guarantee. It also does not make a 51% estimate a claim of certainty: a candidate close to even odds retains a substantial chance of losing.
The journal’s comparison of markets and forecaster panels examines the venue disagreement. Gallup adds a different lesson: identify precisely what a survey measures before using it as evidence for a forecast. Enthusiasm, turnout expectations and win probabilities may be related, but they are not interchangeable numbers.