
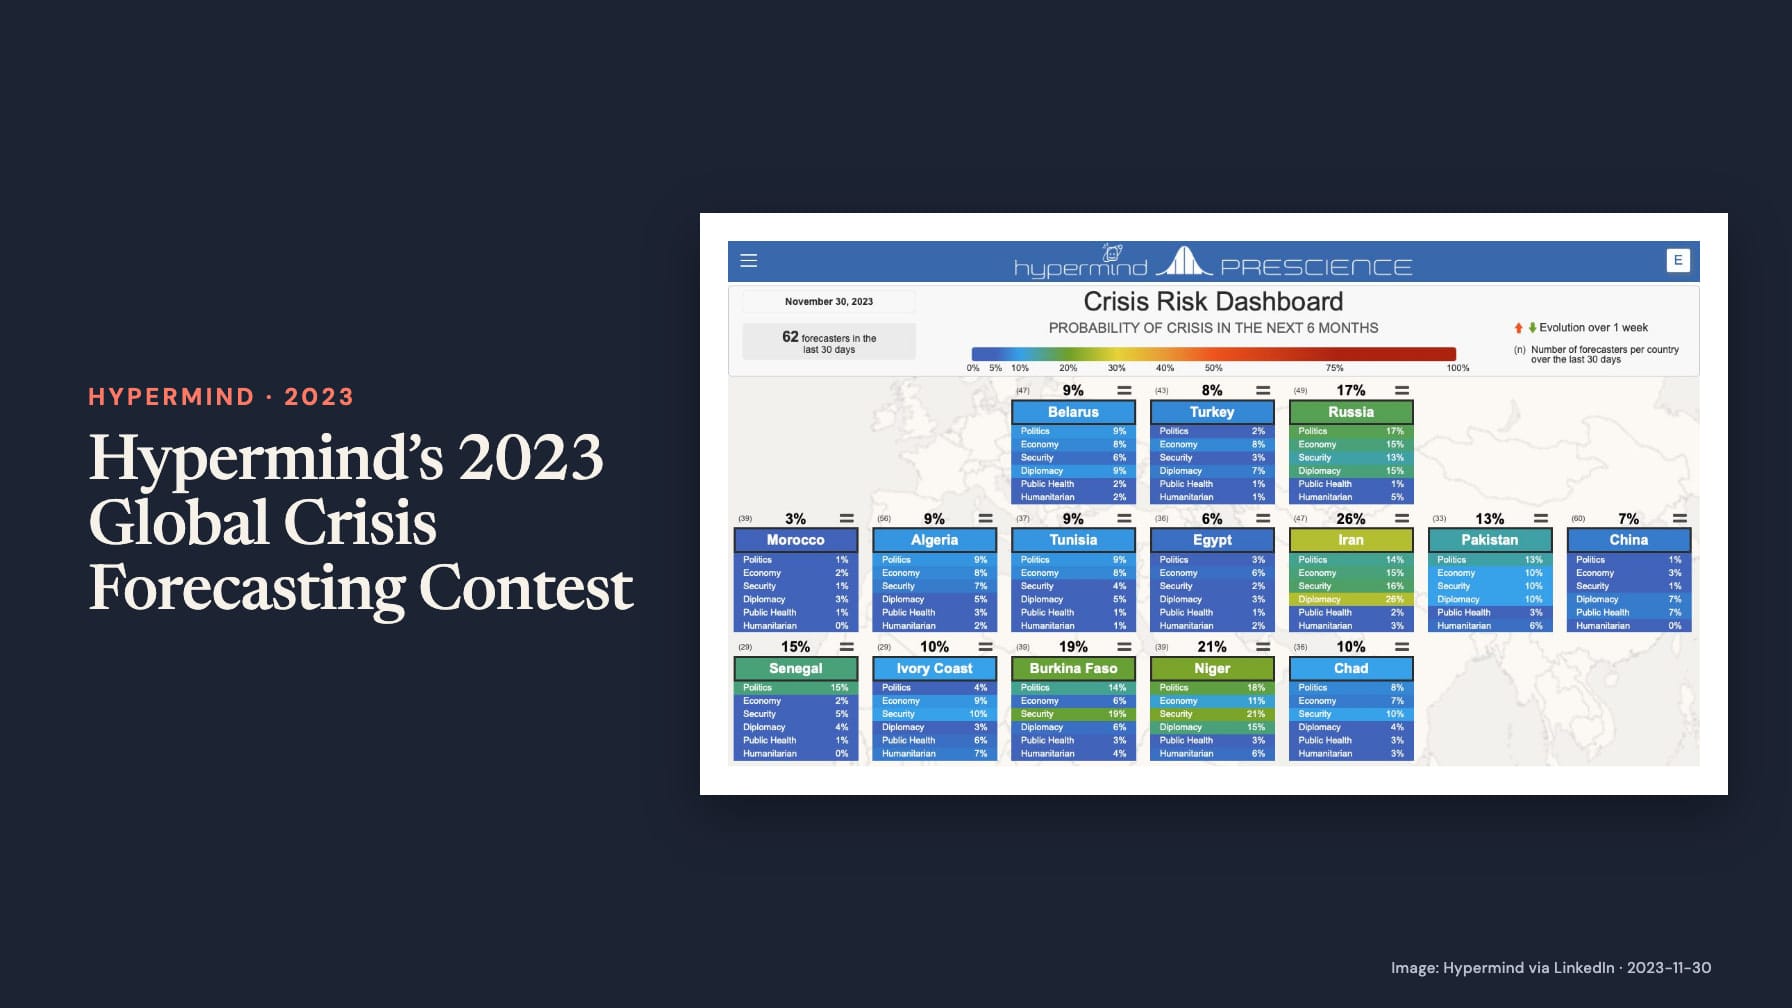
On 30 November 2023, Émile Servan-Schreiber shared Hypermind’s announcement of a geopolitical forecasting contest. The company named wars, coups, natural disasters and citizen revolts as examples of crises and invited participants to forecast where trouble might strike next. The attachment provides a more concrete record: a Crisis Risk Dashboard bearing the same date.
A six-month horizon, divided by risk
The Hypermind Prescience dashboard labels its figures as probabilities of crisis in the next six months. It reports 62 forecasters active over the preceding 30 days, with separate participant counts for each country. Its six rows distinguish politics, economy, security, diplomacy, public health and humanitarian risk. Country cards therefore contain several different forecasts rather than a single interchangeable measure of trouble.
- Iran: diplomacy 26%, security 16%, economy 15% and politics 14%.
- Niger: security 21%, politics 18% and diplomacy 15%.
- Burkina Faso: security 19%, politics 14% and economy 6%.
- Russia: politics 17%, economy 15% and security 13%.
These are the figures visible in the 30 November snapshot. The dashboard also includes countries such as Morocco, Algeria, Tunisia, Egypt, Pakistan and China. Its legend tracks changes over a week, distinguishing rising, falling and stable estimates. That presentation makes both the forecast horizon and the direction of recent revisions visible.
Defining a crisis before scoring it
Hypermind’s official Prescience documentation describes collecting and aggregating probability forecasts, with several question formats and scoring arrangements. That provides context for the tool pictured. A dashboard can organise many questions into a common view while preserving their differences: the location, kind of event and forecast horizon each remain part of the probability claim.
Scoring requires the definitions used for each kind of crisis, the deadline and the aggregation rule; those contest rules are not available here. A political disruption and a humanitarian emergency can have different thresholds and evidence. Several risks can also arise together, so the rows should not be added as though they were mutually exclusive outcomes.
The contest provides a concrete example of making concern specific: identify a place, a risk and a time window, then publish an estimate that can change. As the Ukraine forecast case study illustrates, assessing a forecast requires the original question as well as what happened. The six-month horizon gives the dashboard a defined period of interest, while its separate categories help readers see what kind of trouble participants were considering.